
The following article describes the permutation test as it is employed in Scaffold Q+S. Use the links below to navigate to specific sections of this document.
- Introduction
- Samples and Categories
- The F-statistic as a Measure of Differential Expression
- The p-value and the Probability of a Contradiction
- Assume No Differential Expression
- The p-value as a Number of Extreme Values in a Reference Distribution
- The t-test, ANOVA and their Non-parametric Cousins
- p-values and Density Charts
The permutation test is a quantitative assessment of whether the protein abundance is differentially expressed between categories of samples. To understand how the permutation test measures differential expression, we must:
- Define how Scaffold Q+S groups samples into categories to compare them
- Define the F-statistic, the measure that the permutation test uses to quantify differential expression
- Understand the convoluted logic commonly employed by statistical tests
- See how permutations can be used to build a reference histogram of F-statistics
- Compare the actual F-statistic to the reference histogram
Samples are grouped into categories when organized in Scaffold Q+S. For example, the samples R1 and R2 before treatment might be in category "Reference" and the samples after treatment, T1 and T2, in category "Treatment". The statistical tests in Scaffold operate on differences between Reference and Treatment quantitative values. These tests are not designed to tell the difference between samples T1 and T2.
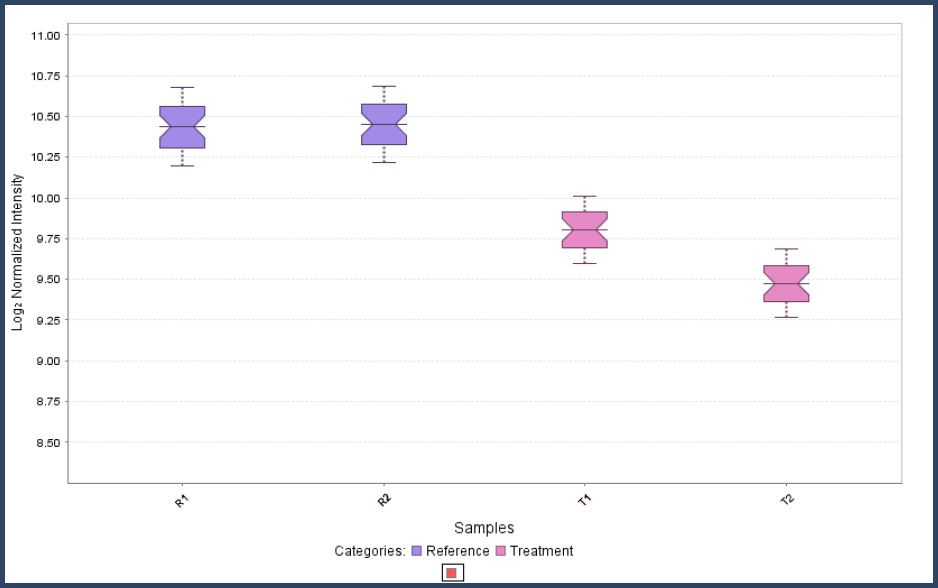
Figure 1. Samples R1 and R2 are in the category "Reference". Samples T1 and T2 are in category "Treatment". Differential expression is defined as the comparison between categories.
Before considering differential expression, first consider how the protein abundance is estimated from the measurements. Each reporter ion channel on each of the protein's spectra for iTRAQ or TMT, or each of the proteins for SILAC, is considered a replicate measurement.
The normalization done by Scaffold removes the variation caused by differences between replicate samples. This normalization also removes the variation caused by differences within a samples between the spectra (iTRAQ or TMT) or peptides (SILAC or precursor intensity).
The remaining variation is that between sample categories, plus some inevitable random measurement error. Determining if the variation between categories is significant is the job of a one-way statistical analysis. A one-way analysis can have two, three or more categories. If there are two categories then the permutation test is a more robust version of the t-test. It is even more robust than the Mann-Whitney test, the non-parametric version of the t-test. If there are three or more categories, then the permutation test is a more robust version of the one-way ANOVA or its non-parametric equivalent, the Kruskal-Wallis test.
Scaffold statistical tests are not designed to analyze more complex experimental designs. For example, an experiment where the samples varied by both mouse strain and dosage must be analyzed by a more powerful statistical package.
The F-statistic as a Measure of Differential Expression
Now that we understand that we are measuring differential expression between categories, let's see how the permutation test measures this differential expression. In proteomics, differential is most often given as a fold change. Scaffold Q+ converts fold changes to the log2 of the fold change for a few key reasons. The log fold change has the advantage that it is symmetric around no change. If in category "Reference", the protein is twice as abundant as in category "Treatment", the log is 1.0. If it is half as abundant, the log is -1.0. Logs have another property that makes using them convenient, namely that:
log(A/B) = log(A) - log(B)
This means that if we plot the log of the intensities, the log fold change can be read off as the distance between the log intensities.
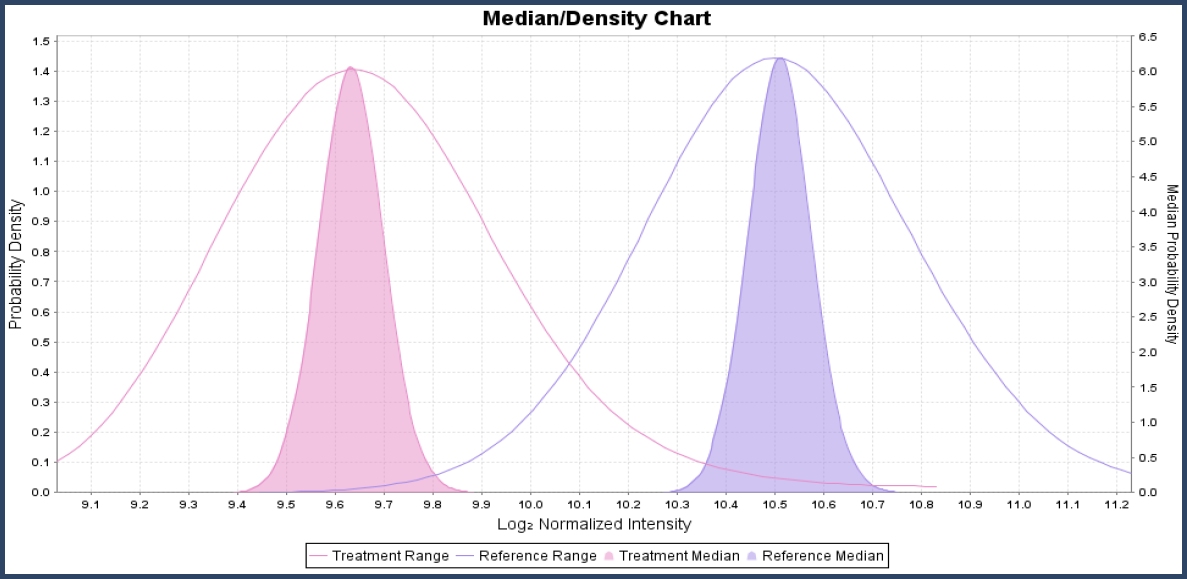
Figure 2. The log fold change is the distance between the log intensities. Here the Reference category is centered at 10.75 and the treated category is 9.75. The difference 10.75 - 9.75 = 1 corresponds to a log fold change of 1 or a fold change of 2.
For statistical tests, the distance just discussed between the categories is one factor with the other factor being how precisely each value is known. In statistics, the imprecision is the width of intensity distribution and is usually measured by the standard deviation. For the t-test these two factors are combined by scaling the distance in units of the standard deviation. This scaled distance is called the F-statistic calculated as:
F-statistic = explained variance / unexplained variance
The p-value and the Probability of a Contradiction
Statistical tests have a particular sort of logic that at first seems counter intuitive. The permutation test uses this logic to determine differential expression so we will take a little side journey to introduce this way of thinking. You may recall from math classes the concept of "proof by contradiction". The idea behind proof on contradiction is that you assume something and then show it leads to a contradiction. This contradiction shows that your assumption is false and so the opposite of the assumption must be right.
The statistical hypothesis tests work in much the same convoluted way. In a t-test, ANOVA, or a permutation test you assume that there is no differential expression between the categories. Now you set about trying to prove that assumption wrong, or at least very unlikely. The p-value is the probability that the assumption is right. If the p-value turns out to be very small, say less that 0.05, then the assumption is most likely false. If the assumption that there is no differential expression is most likely, then there is most likely differential expression.
To summarize the backwards logic, the permutation test assumes that there is no differential expression and the p-value is examined to determine if this assumption is true. A small p-value means that there is differential expression.
Assume No Differential Expression
The permutation test between categories assumes that there is no differential expression between them when the differential expression is calculated using the t-statistic. It then sets out to calculate a p-value to find out how likely this assumption is wrong. The trick the permutation test uses to calculate the p-value depends upon building a reference histogram of F-statistic values. This reference histogram is made by permuting the measurements between the categories.
Let's look at an example to see how this works. Figure 3 shows example data in two categories that will be used for the permutation example. In the probability density chart in Figure 4, you can see the distributions overlap a fair amount and the confidence intervals of the medians overlap a smaller amount.
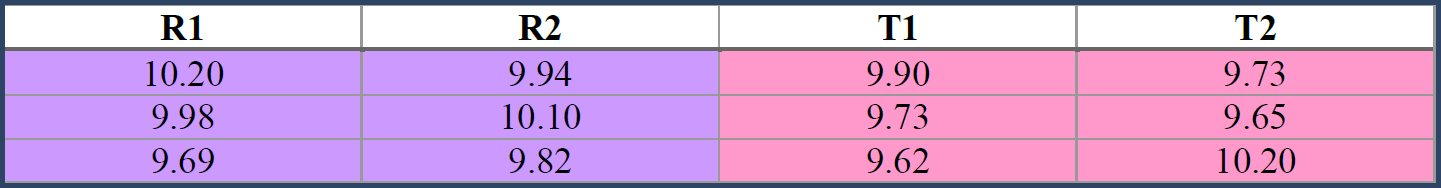
Figure 3. Sample data for calculating a reference distribution
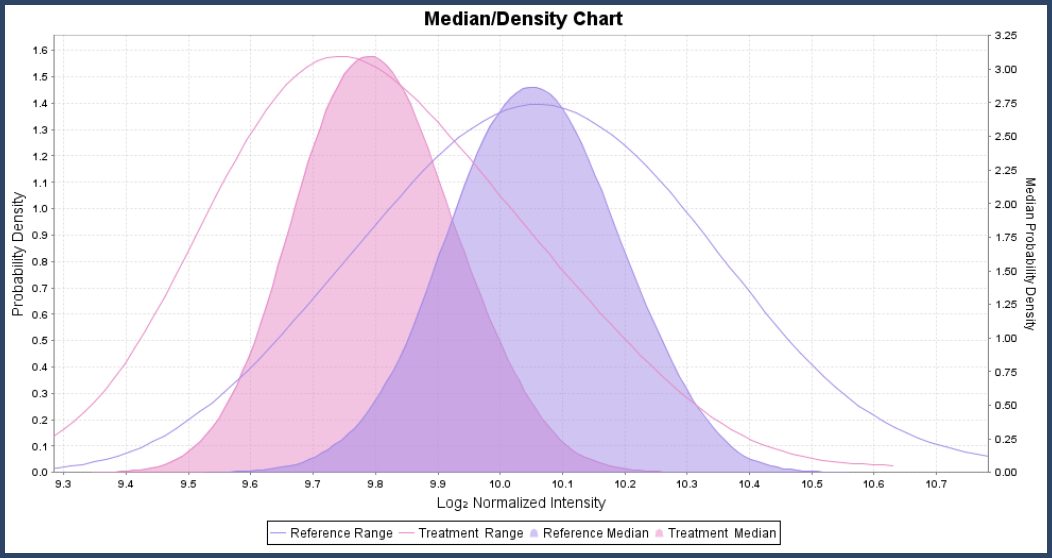
Figure 4. Are these two distributions significant different?
The t-statistic calculated for the distance between these two distributions is 6.1. We will now build a reference distribution to see if this is statistically significant.
The assumption we are setting up to refute is that there is no differential expression. Another way of looking at this is that the data in the "Reference" samples and the data in the "Treatment" samples are part of the same distribution. Since all the data comes from the same distribution, it makes do difference if we swap some of the data between categories. This swap is shown in Figure 5.
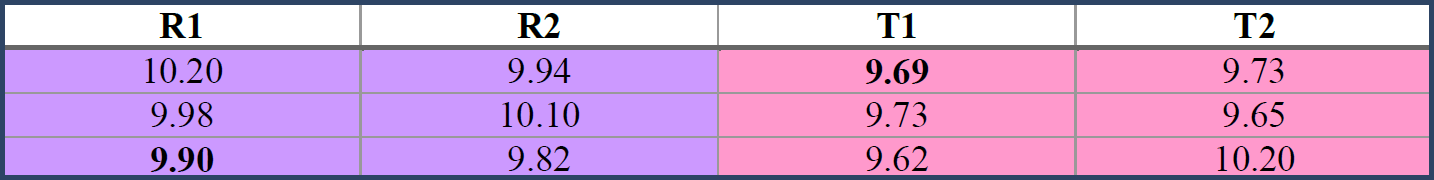
Figure 5. The table results from swapping 9.69 from the "Reference" category with 9.90 in the "Treatment" category. This lower configuration will show a slightly smaller F-statistic measuring the differential expression.
Since the values in the Reference category are now larger and the values in the Treatment category are smaller, it is easy to see that the F-statistic will be swapped in this case. The value of this F-statistic is calculated and plotted on a histogram.
Now this procedure is repeated with other values swapped between the "Treatment" and "Reference" categories, the F-statistic calculated, and plotted on the histogram. This is repeated over and over, swapping not just one value but any random combination of one or more values between categories. This repeated swapping or permutation gives the test its name. The histogram that results from permuting the values 1,000 times is plotted in Figure 6. This is the reference F-statistic histogram for this protein.
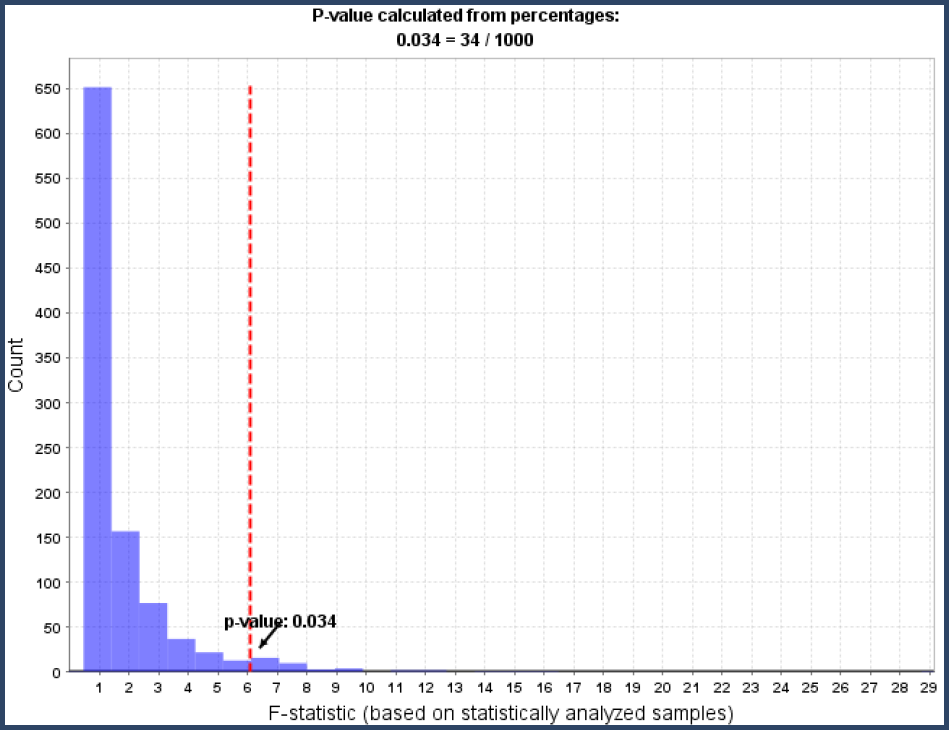
Figure 6. Reference histogram resulting from permuting the values between the categories and calculating the F-statistic for each permutation.
The reference histogram shows how often random permutations of the values between categories will result in each F-statistic distance. These F-statistic counts all arise from random changes to the original data under the assumption that there is no differential expression.
The goal is to set up an assumption, that there is no differential expression and see if the data knocks it down. In this section, we have seen the differential expression that might be calculated by mere chance variations. The next section will discuss whether this evidence is enough to knock down the assumption of no differential assumption.
The p-value as a Number of Extreme Values in a Reference Distribution
The reference F-statistic histogram shows how the calculated differential expression varies under random permutations when it is assumed that there is no real differential expression. The F-statistic that was calculated for the actual measured intensities is 6.1. This value is plotted as a red dashed line in Figure 6. Those 34 histogram values which are greater than the red line in Figure 6 arose by chance. This says that 34 out of 1000 times, the measured differential expression (-0.26) could be explained merely by random permutations. That is the p-value, the probability that the assumption is true is 34/1000. Recall the contorted logic of p-values. A p-value of 0.034 is quite small, which therefore means that it is unlikely the assumption of no differential expression is true. In other words, it is likely that there is differential expression.
A minor extension of the permutation test is to extrapolate the reference F-statistic distribution to more extreme values. As can be seen in Figure 7, this can give estimates of the p-value when the measure F-statistic is more extreme than any of the 1,000 permutations. As can also be seen in Figure 7, the data used for the extrapolation does not fit real tightly to the exponentially decreasing line which means that the resulting p-values are approximate; they may be off by an order of magnitude.
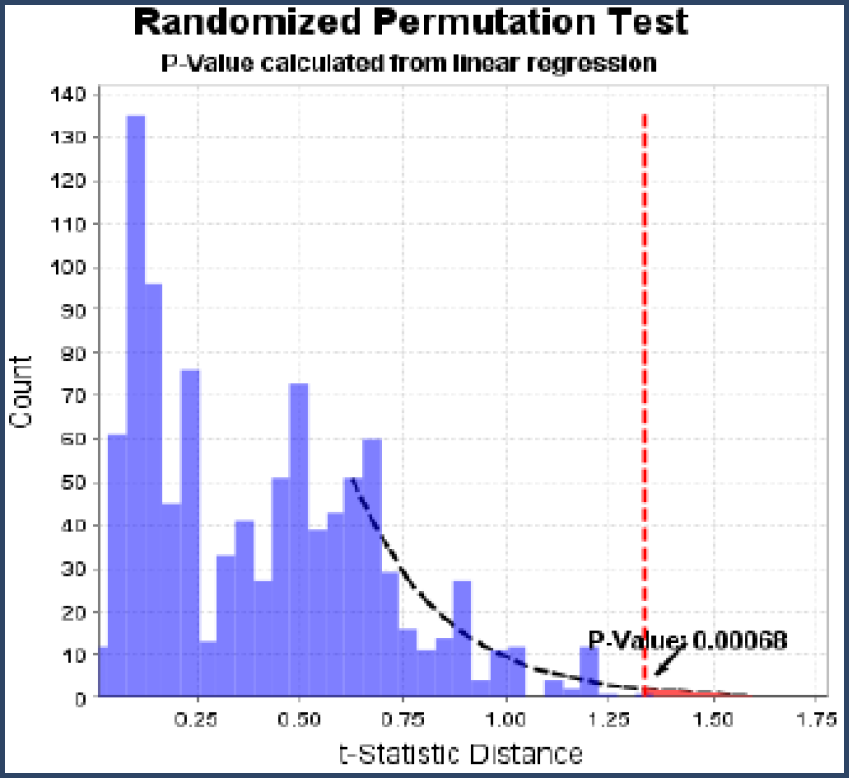
Figure 7. When the measured F-statistic, the red line, is more extreme than the 1,000 permutations, the reference distribution can be extrapolated.
To recap, the permutation test sets up the assumption of no differential expression and sees how often random fluctuations could result in a measurement as extreme as that actually seen. If these random fluctuations are seldom as large as the actual measured differential expression, then we believe in the differential expression.
The t-test, ANOVA and their Non-parametric Cousins
The t-test, ANOVA and those statistical tests that have somebody's name attached to them all work in a closely related manner. The principal difference is that the reference distribution was calculated fifty or a hundred years ago by assuming a number of characteristics about the data. These reference distributions are now stored in tables of numbers or computer algorithms. The permutation test is much more robust as it calculates the reference distribution directly.
Scaffold provides color coding of p-value results to draw attention to those proteins whose differential expression is statistically significant. Cells colored with a green background indicate p-values that fall below the alpha level and are significant while p-values with a white background are not considered significant (above the alpha level). If multiple-test correction has been applied such as the Benjamini-Hochberg test, those p-values below the alpha level but above the multi-test corrected adjusted alpha level will be shaded orange.
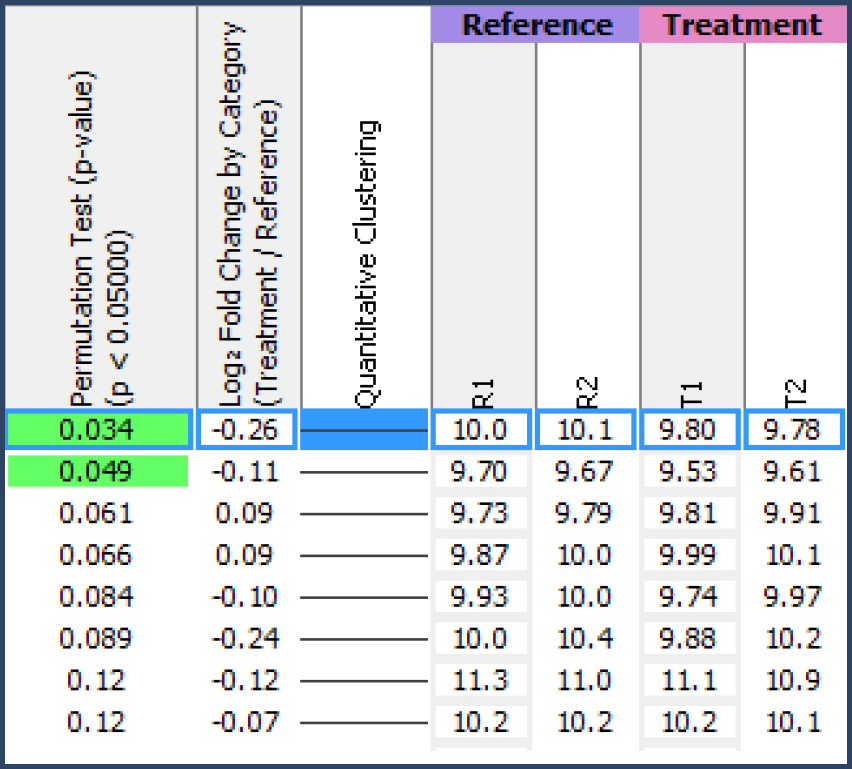
Figure 8. Scaffold Q+S colors green the p-values for those proteins with significant differential expression.
Another sanity check on whether a protein is differentially expressed between categories is to look at its category level chart. The lines on these charts show the probability that the intensity measurements for a category fall in a certain range. The colored curve shows the confidence interval for the median of the measurements, see Figure 9.
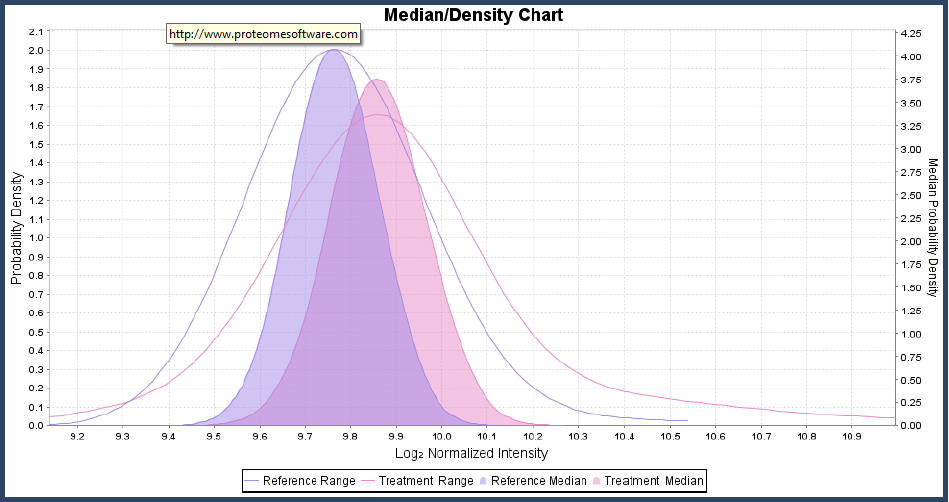
Figure 9. The probability that measurements will fall in a given range is given by the lines. The colored sections show the confidence intervals for the medians of the distributions.
If the confidence intervals for the medians for the different categories do not overlap much, then the protein is most likely differentially expressed. If the confidence intervals overlap a lot, it is unlikely the proteins are differentially expressed. When there are only a few measurements for each category, then the category level charts can look differentially expressed but the permutation test may report a high p-value. These situations require more data to make an accurate determination.